

DIY Block-Parallel Data Analysis
in Analysis
[View PDF] Dmitriy Morozov (LBNL) Tom Peterka (ANL) Objectives DIY is a programming model and runtime for block-parallel analytics on DOE leadership machines. Its main abstraction is block parallelism: all parallel operations and communications are expressed in terms of blocks, not processors. This enables the same program to run in- and out-of-core with single or… Read more

OSUFlow+VTK Integration
in Visualization
[View PDF] Chun-Ming Chen, (Kitware, Inc.)Han-Wei Shen, (OSU) Berk Geveci (Kitware, Inc.)Tom Peterka (ANL) Objectives Visualize large scale flow simulation data such as Nek 5000 and MJO climate simulations Make available advanced parallel and out-of-core integral curve computation algorithms to the application scientists Support three-dimensional time-varying vector… Read more

New Data-parallel Algorithms Accelerate Cosmology Data Analysis on GPUs
in Visualization
[View PDF] Jim Ahrens, Chris Sewell, and John Patchett (LANL) Objectives Milestone Implement application-specific visualization and/or analysis operators needed for in-situ use by LCF science codes Use PISTON to take advantage of multi-core and many-core technologies Target Application The Hardware/Hybrid Accelerated Cosmology Code (HACC) simulates the distribution… Read more

Relativistic Radiation from Kelvin-Helmholtz Instability
in Visualization
[View PDF] Dave Pugmire (ORNL) VisIt and PIConGPU VisIt: Large data parallel visualization tool Rich set of visualization and analysis plots and operations Plug-in API allows for easy extension PIConGPU: Particle code running on Titan Simulation of hundreds of billions of particles on 18,000 nodes of Titan Result/Impact Developed a VisIt data reader for the field… Read more

NSF/DOE Community Atmospheric Model: Total Precipitable Water Visualization
in Visualization
[View PDF] Kenneth Moreland, SNL Objective The Climate Science Computational End Station (CCES) aims to predict future climates by using scenarios of anthropogenic emissions and other changes resulting from U.S. energy policy decisions. Technology NSF/DOE Community Atmosphere Model (CAM5): A 3D global model used to predict atmospheric behavior and its effect on other… Read more

Massively Threaded Visualization Algorithms for the Next Generation of High Performance Computing
in Visualization
[View PDF] Kenneth Moreland, SNL Objective Develop readiness for scientific data analysis and visualization at extreme scale. Address challenges of emerging architectures. In addition to designing our own algorithms, build a toolkit that enables others to build algorithms. Technology The Dax Toolkit: a visualization toolkit containing a framework that reduces the… Read more
PIC simulations of heating in the solar wind resolve full spectrum of physics down to electron scales
in Visualization
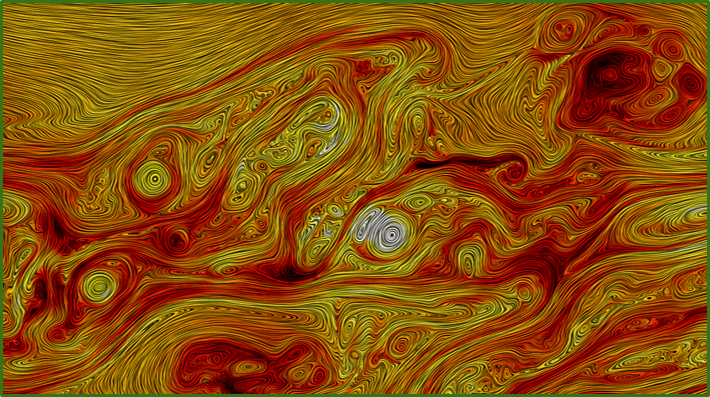
[View PDF] H. Karimabadi, U-CaliforniaW. H. Matthaeus, U-DelawareW. Daughton, LANLB. Loring, LBNL Objectives Analyze the full spectrum of heating modalities from those measured in units of Earth radius down to those measured on the scales of electron interactions Interactive remote visualization and analysis of the entire dataset across the entire range of physical… Read more

Space Weather, global simulations of solar wind interaction with the Earth's magnetosphere
in Visualization
[View PDF] Patrick O'Leary, Kitware Inc.Burlen Loring, LBNL Objectives Enable in situ visualization for global hybrid (electron fluid, kinetic ions) simulations used to study the interaction of the solar wind with planetary magnetospheres such as the Earth and Mercury Directly embed ParaView Catalyst in a tightly coupled manner with UH3D code to perform scalable… Read more

Remote Visualization of Complex Phenomena on Very Large Datasets
in Visualization
[View PDF] Berk Geveci (Kitware), Jim Ahrens (LANL) Objectives To understand the 3D evolution of tearing modes (causing plasma instabilities) in simulations of magnetic reconnection Challenges Large data size generated by high resolution simulation on 98304 cores 6.4 billion cells,1.5 trillion particles, 57 TB data Only remote access to the supercomputer Lack of… Read more

ParaView Enables the Remote Analysis of 1 Billion Element Mesh
in Visualization
[View PDF] Kenneth Jansen, U. ColoradoMichel Rasquin, ArgonneBerk Geveci, Kitware, Inc. Objectives Simulate and analyze synthetic jet flow control using the finite element method Use mesh adaptivity to fully resolve all required physical scales Analyze and visualize the resulting 1 billion element mesh per time step solution to study the effect of flow control … Read more

Visualizing data from the BOUT++ framework for fluid/plasma simulations
in Visualization
[View PDF] Eric Brugger (LLNL) Objectives BOUT++ is a framework for writing fluid / plasma simulations in curvilinear geometry Provide a visualization capability for BOUT++ data beyond visualizing it as simple 2- and 3-dimensional arrays Want to be able to look at the data as it would appear in the physical world Impact They are now able to visualize their data as it… Read more

FastBit - Efficient Search Technology for Data Driven Science
in Data Management
[View PDF] John Wu, Arie Shoshani (LBNL) Problem Quickly find records satisfying user-specified conditions from a large, complex data set Example: High-energy physics data – from billions of events find collision events with a given energy level and having a specified number of tracks Solution Developed new indexing techniques and a new compression method for the… Read more

FastQuery: providing database capabilities for scientific files
in Data Management
[View PDF] K. Wu, S. Byna, A. Shoshani, in collaboration with LBNL Vis group Key Ideas Provide uniform array interface for scientific data in commonly used file formats, e.g., HDF5, ADIOS, and NetCDF Provide efficient searching functionality on top of existing user analysis frameworks while expand data handling capability and improve user productivity Results Public… Read more

Scaling Parallel I/O and Analysis to a Trillion Particles
in Data Management
[View PDF] Prabhat (PI), Suren Byna, Oliver Rubel, John Wu, LBNL Objectives Ability to analyze very large datasets quickly to enhance scientific understanding and discovery Enhance I/O on HDF5, a popular file format used by many application domains Demonstrate these capabilities on Trillion particle plasma physics simulation Accomplishments Trillion particle plasma… Read more

ADIOS Visualization Schema for VisIt
in Data Management
[View PDF] Dave Pugmire, Gary Liu, Scott Klasky (ORNL) VisIt and ADIOS VisIt: Large data parallel visualization tool Rich set of visualization and analysis plots and operations Plug-in API allows for easy extension ADIOS: adaptable I/O framework Provides portable, fast, scalable, easy-to-use, metadata rich output with a simple API Visualization Schema provides an xml… Read more

15% More Accuracy in Seasonal Hurricane Forecasts through Comparative Climate Networks Analytics
in Data Management
[View PDF] Nagiza Samatova NCSU/ORNLFred Semazzi NCSU Objectives Develop predictive forecasting methodology for climate extremes (e.g., hurricanes, droughts, rainfalls) Devise scalable algorithms for predictive mining of large-scale climate complex networks Provide mechanistic insights about the key factors contributing to extreme events variability Demonstrate high… Read more

Accelerating Science Input/Output on Leadership Platforms
in Data Management
[View PDF] Rob Ross, ANL Objectives Standards-based Input/Output (I/O) interfaces are a cornerstone of DOE science codes The ROMIO MPI-IO implementation is the most widely used I/O library in HPC systems Tuning ROMIO for specific platforms is critical for performance of many applications Approach I/O "proxy applications" such as the HACC-IO cosmology I/O represent… Read more

Visualization for Geo Sciences
in Data Management
[View PDF] Dave Pugmire, ORNL VisIt and ADIOS VisIt: Large data parallel visualization tool Rich set of visualization and analysis plots and operations Plug-in API allows for easy extension ADIOS: adaptable I/O framework Provides portable, fast, scalable, easy-to-use, metadata rich output with a simple API Result/Impact Developed a parallel SpecFM3D ADIOS reader for… Read more

Visualization Support for Fusion
in Data Management
[View PDF] Dave Pugmire, ORNL VisIt and ADIOS VisIt: Large data parallel visualization tool Rich set of visualization and analysis plots and operations Plug-in API allows for easy extension ADIOS: adaptable I/O framework Provides portable, fast, scalable, easy-to-use, metadata rich output with a simple API Result/Impact Developed a parallel XGC ADIOS reader for… Read more

DIY: Enabling large-scale data-parallel analysis
in Data Management
[View PDF] Tom Peterka, ANL Main Ideas and Objectives Decouple analysis technique (user) from data-intensive parallelism (DIY) Enable large-scale data-parallel analysis (visual and numerical) on all HPC machines (IBM & Cray leadership machines) Provide internode scalable data movement For scientists, visualization researchers, tool builders For in situ, coprocessing,… Read more

Scalable In-Memory Data Indexing and Querying for Scientific Simulation Workflows
in Data Management
[View PDF] Manish Parashar, Rutgers Target Application S3D combustion simulation (Jacqueline Chen and Hemanth Kolla, Sandia National Laboratory) Goal: Identify flamefronts (a transient phenomena) at runtime in combustion simulations Data Management Challenges Develop capabilities for interactive queries with low latency, operating on live simulation results Efficient… Read more

In situ code coupling and analysis - an essential capability for advanced large scale simulations
in Data Management
[View PDF] Manish Parashar, Rutgers Objectives Provide tools for online and In-situ data analytics E.g. visualization, feature tracking Enable integrated and coupled multi-physics simulation E.g. integrated climate modeling, fusion simulation, subsurface modeling, material science workflows Impact Enable in-situ execution of coupled scientific workflow Enabled… Read more

Facilitating In-Situ Analytics for Complex AMR-based Simulation Workflows
in Data Management
[View PDF] Manish Parashar, Rutgers Objective Manage dynamic data processing requirements at extreme scales using coordinated algorithm, middleware and resource layer adaptations Target Applications Dynamic AMR-based simulations such as the Polytropic Gas simulation for modeling tokomak edge plasma (part of Chombo developed by LBNL) Data Management Challenges Large… Read more

Darshan: Improving I/O performance for scientific applications
in Data Management
[View PDF] Robert Ross, ANL Application Darshan collects concise I/O access pattern information from large-scale applications Goal Users: improve the performance of critical scientific applications Administrators: gain insight into storage system deployments and usage Researchers: guide future research directions HPC I/O Requirement Negligible impact on production… Read more

Gene Context Analysis Now Performed in Seconds
in Analysis
[View PDF] A. RomosanA. ShoshaniK. WuV. MarkowitzK. Mavrommatis The figure shows the bitmap representation of cassette properties, and finding matching combinations Challenge: to find all the results requires trying all Possible combinations. In this example 3x3x2=18. For millions of cassettes this search is exponential. Approach Reorganize the list of functions per… Read more

Multivariate Data Analysis Made Easy
in Analysis
[View PDF] Ayan BiswasSumya DuttaHan-Wei Shen (OSU)Jonathan Woodring (LANL) Objective Analyze large scale multivariate scientific data sets Understand the relationship between the variables and their importance Understand the correlation and variability between user-selected variables Create an intuitive graphical user interface that allows the scientists to perform… Read more
")
Analysis and Visualization of Madden-Julian Oscillation (MJO)
in Analysis
[View PDF] Han-Wei Shen, OSU Application Climate modeling by Dr. Ruby Leung and Dr. Samson Hagos at PNNL Simulation Goal: Understand MJO A complex cloud system in multiple scales over the Indian and Pacific oceans An important weather phenomenon related to the tropical intra-seasonal change Requirement: Time-varying Feature Tracking Visualizing the movement of… Read more

Flexible In-Situ Analytics
in Analysis
[View PDF] Karsten Schwan, Greg Eisenhauer, Matt Wolf, and Ph.D. studentsGeorgia Institute of Technology, CERCS Research Center Applications GTC, GTS, Pixie3D Fusion applications LAMMPS materials modeling code S3D combustion code Problems Rapid output processing for timely science insights Large I/O output data volume Coupling to science users Technology Basis ADIOS… Read more

Topological and Statistical Analytics of Turbulent Combustion
in Analysis
[View PDF] Valerio Pascucci, U-Utah Application Turbulent Combustion by Dr. Jackie Chen at SNL, and Dr. John Bell at LBNL Goal: understanding turbulent combustion Combustion provides 85% of the US energy needs Low emission/temperature engines will operate at combustion regimes currently poorly understood Need new understanding of turbulence-chemistry
to predict… Read more

Time-Varying Data Analysis with Time Activity Curves
in Analysis
[View PDF] Valerio Pascucci, U-Utah Technology Robust analysis based on topological definitions Fast parallel evaluation of dependent statistics Compute graph abstractions for multi-resolution feature representation Computer graph models of concurrent tracking of features at multiple scales Fast access and computation of dependent statistics Result/Impact Orders of… Read more

Significant Efficiency Increase in Scientific Workflow Through In Situ Analysis with ParaView Catalyst
in Analysis
[View PDF] Chris Sewell, Jim Ahrens, LANLBerk Geveci, Patrick O’Leary, Kitware Inc. Objectives Disk I/O has become a significant bottleneck for large scale simulations and data analysis of simulation output In situ analysis aims to embed data analysis and visualization into the simulation to reduce the need for disk I/O Our objective is to demonstrate the feasibility… Read more

Meshing the Universe: In Situ Voronoi and Delaunay Tessellation
in Analysis
[View PDF] Tom Peterka, Juliana Kwan, Adrian Pope, Hal Finkel, Katrin Heitmann, Salman Habib, ANLGeorge Zagaris, Berk Geveci, KitwareWei-keng Liao, NU Objectives Parallelize computational geometry algorithms and deploy in cosmology simulations at scale Transform sparse point cloud data into a continuous field (tessellation) that can be interpolated everywhere Use… Read more

Big Data Means Big Issues for Exascale Visualization
in Data Management
DOE ASCR DISCOVERY – New Faces Posted August 8, 2012 When exascale computers begin calculating at a billion, billion operations each second, gaining insights from the massive datasets generated by the simulations they run will be a huge challenge. Scientists may be tempted to pause the simulation, effectively "holding the machine hostage" as they scramble to create… Read more

Refining hurricane forecasts by connecting the dots
in Analysis
ASCR DISCOVERY – At the Universities Posted June 20, 2012 By graphing points in Earth's roiling atmosphere with the aid of the latest petascale-power technology, scientists collaborating on Department of Energy-funded research say they could improve major seasonal North Atlantic hurricane forecast reliability by more than 25 percent. At the Universities features… Read more

Parallel Distance Field Computing
in Analysis
[View PDF] Kwan-Liu Ma, UC Davis Depiction of a distance field computed from a feature surface in data generated by a combustion simulation. Technology Distance field computing is fundamental to many data analysis and visualization applications. This project realizes a highly scalable parallel implementation to support in situ processing and data reduction. The… Read more

Visualization of Laser Back Scatter
in Visualization
[View PDF] Eric Brugger (LLNL) Application Laser back scatter modeling by Dr. Steve Langer at LLNL Technology Ability to view data using a client/server architecture Ability to interactively set transfer function to bring out features of interest at key points in the simulation Ability to quickly generate side-by-side animations of key physics quantities to… Read more

I/O bottlenecks and analysis challenges faced by applications running on leadership systems
in Data Management
[View PDF] Visualization of Type 1A supernova explosion FLASH simulation • FLASH is multi-scale, multi-physics code used in domains including astrophysics, cosmology and high-energy density physics. • It uses a block-structured AMR, and at 32K cores, I/O time is about 30% of the entire run achieving a max of 1GB/s out of 35 GB/s on the ALCF Intrepid BG/P system. •… Read more

Glean
in Analysis
[View PDF] GLEAN is a flexible and extensible framework to facilitate simulation-time data analysis and I/O acceleration. Features include: topology-aware data movement, asynchronous data staging and burst buffering, leverages application data models, scalable analysis algorithms and infrastructure (in situ, co processing, in flight). Scaled to entire ALCF… Read more