
|
|||||||
| Summary | Applications | Compression | Range Queries | Publications | Software | ||
Projects using FastBit on GitHub
Related projects on google code
September 2009: FastBit in SciDAC Review [PDF version]
December 2008: FastBit featured in DOE - Science - ASCR Discovery.
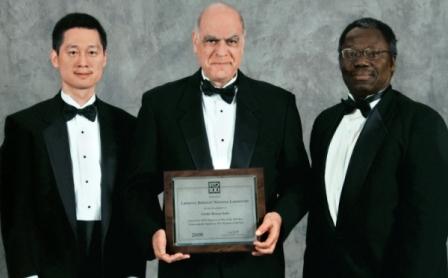
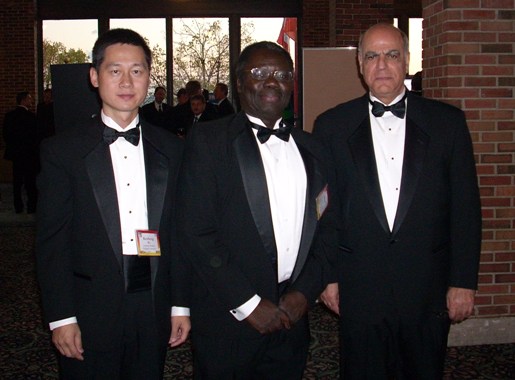
July 2008: FastBit recognized as one of 100 most innovative new products by R&D magzine [Note from Representative Ellen Tauscher] [News release] [Poster for R&D 100 Award Receiption] [Photo 1 from the R&D 100 Award Receiption] [Photo 2 from the R&D 100 Award Receiption]
March 2008: FastBit made its way to UC Davis Visualization group, appeared in work on Bin-Hash Indexing: A Parallel GPU-Based Method For Fast Query Processing .
August 2007: A research group in Germany has applied FastBit technology to virtual screening for molecular docking used by pharmaceutical companies among others. At the ACS Fall 2007 meeting, Jochen Schlosser and Matthias Rarey presented this new virtual screening tool named TrixX-BMI, and showed that it can screen libraries of ligands 140--250 times faster than the state of art screening tools (see page 18 of their presentation at ACS Fall 2007 meeting, full article in J. Chem. Inf. Model., Article ASAP, DOI: 10.1021/ci9000212).
June 2007: A paper jointly produced by the developers of RIDBit and FastBit examines the physical design aspects of the two packages, and reveals that the design choices of FastBit are indeed effective. The paper is to be presented at IDEAS 2007 conference.
As computers become more pervasive, many scientific and commercial endeavors are collecting or generating tremendous amount of data. Typically a relative smaller number of records contain the keys to new insight or new trends. One of the most daunting challenges in data analyses or data mining is to quickly retrieve these useful records. FastBit answers this challenge with an efficient compressed bitmap index technology. Here are a few applications that involve the FastBit developers.
Ever since Dr. Lawrence created his first particle accelerator, there has been a race to build the next big accelerator, where the 2008 world record is a 26-kilometer behemoth in CERN. However, such trend is simply not sustainable, no funding agency is prepared to put the money for the next bigger one. Here enters a new technological break through -- Laser Wakefield Particle Accelerator. It has the potential of put the many kilometer long accelerator back on a table top. FastBit has been used extensively in the analysis of simulation results on Laser Wakefield Particle Accelerator. More specifically, it has been used to produce histograms used in the parallel cooridinate display (used for interactive exploration of data), for selecting particles and tracking particles. (For more details see LBNL-716E.) (Here is a Physorg article on LWFA that mentions the effort at our organization. It provides a good bird's eye view of the new accelerator.) [Visual analysis project] [SC08 publication (Abstract)] [movie]
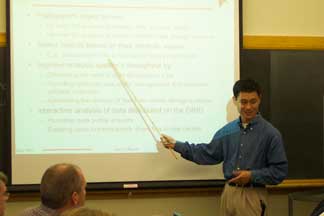
The image on the right is a screen shot from a visual analytic prototype
developed for analysis of network traffic records. This system was
tested on one year's network traffic to and from a national
supercomputer center. In this image, each pixel is an IP address that
some outside machine was trying to contact in a specific duration of
time and different source addresses are marked with different color. We
observe that the six different source machine nearly completely covered
a portion of the address space and there is no overlap between them.
This clearly indicates coordination among the attack machines.
 The details of this work was report in IEEE VAST conference and also
appeared as LBNL tech report LBNL-59891. A
paper describing the histograming
algorithms used for the network traffic analysis was reported at Supercomputing 2006.
The details of this work was report in IEEE VAST conference and also
appeared as LBNL tech report LBNL-59891. A
paper describing the histograming
algorithms used for the network traffic analysis was reported at Supercomputing 2006.
More description about the work on network traffic analysis is also available from the visualization group web site.
March 2007: A joint paper with the developers of TelegraphCQ, the Telegraph dataflow engine, demonstrated that FastBit can index a high rate of stream data by aggregating incoming records into chunks of suitable sizes. This demonstrates a possible way to address the long-standing concern regarding the efficiency of updating bitmap indexes. Paper appeared in SSDBM 2007 conference.
The application that initially motivated our research was a high-energy physics experiment called STAR. One of the main goals of the experiment was to investigate the existence of such state of matter as Quark Gluon Plasma. One indication of the existence of Quark Gluon Plasma is a phenomenon called jet quenching. However, only a small fraction of the high-energy collisions may have this phenomenon. Effectively identifying these key events out of hundreds of millions of collision events stored mostly on tape is a significant challenge. To meet this challenge, we clearly need efficient searching strategies. In addition, we also need to address the file management issues because the distributed nature of the storage systems and analysis resources involved.
While STAR was in planning stages, a software package called STACS was developed to address the need to searching the large number of events. This software was lated replaced by Grid Collector to provide better integration with the new STAR analysis environment. We have documented our progress with reports in IEEE NSS 2003 and CHEP 2004. Grid Collector also won a ISC Award
STAR has some more information about how to use Grid Collector in their applications.

In a number of scientific fields, simulation is the predominant instrument of study. As in an analysis of simulation of hydrogen-air autoignition process, a common analysis task is to track the progression of some particular feature, such as the evolution of the ignition kernel, the propagation of the flame front, or the procession of a shock wave. There are two general categories of existing approaches, one based on visualization techniques or one based on database techniques. The former typically can only performs very simple search operations, therefore unable to process features involving many variables or complex conditions; while the later is better at processing complex conditions, it typically handles spatial characters of the features very slowly. Our compressed bitmap based approach has the unique advantage of efficiently handle both multi-dimensional conditions and complex spatial characters.
Using FastBit, the feature tracking problem can be solved in three steps: first, the searching step to identify cells that satisfy a set of user specified criteria; second, the region-growing step to group the cells into connected regions; and, third, the tracking step to assign global labels to regions from each time step based on their overlap in space. We developed a set of efficient strategies to address all these three steps. The result was reported in SSDBM 2003.
This is an extension of the work on feature tracking. One of the aim is to provide a flexible visual data exploration tool that can interactively process complex user queries on datasets. FastBit is uniquely suited to fill this role of searching, which is very limited in existing visualization tools. In an demonstration at Supercomputing 2004 conference, we show that DEX can find isocontours significantly faster than commonly used visualization tools such as VTK, see technical report LBNL 57023. Clearly, finding isocontours is one of the simplest capability of DEX. In the immediate future, our goal is to design an intuitive interface so that the complex capability can be easily accessible to users.
